Project Telescope: Local Observability to See What Your AI Agents Are Actually Doing
 Cassie Breviu, Daniel Pagan·
Telescope is a local-first observability tool for AI Agents and MCPs, giving teams clear visibility into what agents did, why they did it, and where they got stuck.
AI agents have become a part of our daily workflows. They refactor code, orchestrate sub-agents, call tools, read and write files, and burn through tokens — all while you're sipping your coffee. But here's the problem: its hard to see what they're actually doing.
Until now.
Project Telescope is a local-first observability tool for AI agents. Think of it as DevTools for your AI pair programmer — a live, structured view of everything happening beneath the surface of tools like GitHub Copilot, Claude, and any MCP-compatible agent.
😰 The Problem
| Challenge | What's Happening | |
|---|---|---|
| 🔮 | Black Box Agents | AI agents work in isolation. You can't see what they're doing, what tools they call, or why they make decisions. |
| 🤷 | No Unified View | Multiple agents, multiple logs, multiple formats. No single place to understand the full picture. |
| 🐛 | Hard to Debug | When things go wrong, tracing the issue across agent sessions, MCP calls, and tool responses is painful. |
When you run a traditional CI pipeline, you get logs. When your web app throws an error, you get a stack trace. But when your AI agent decides to spawn three sub-agents, rewrite a config file, and make a network request — what do you get? A chat message that says "Done."
That gap between what agents do and what developers see is growing fast. As agents become more autonomous the need for transparency grows with them.
✨ The Solution
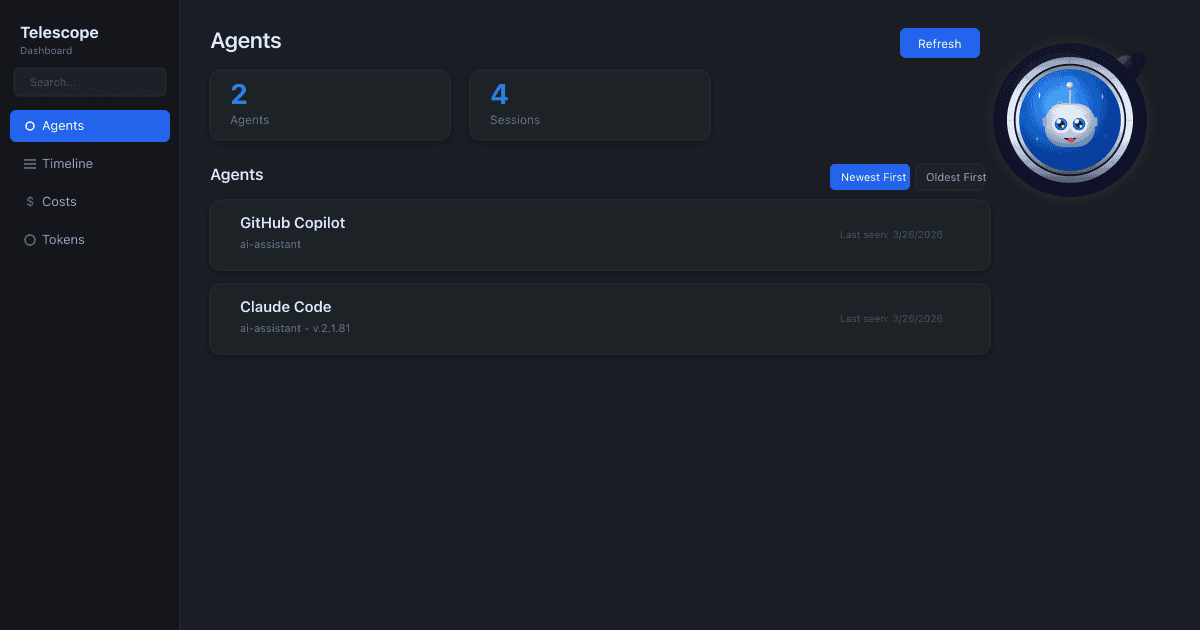
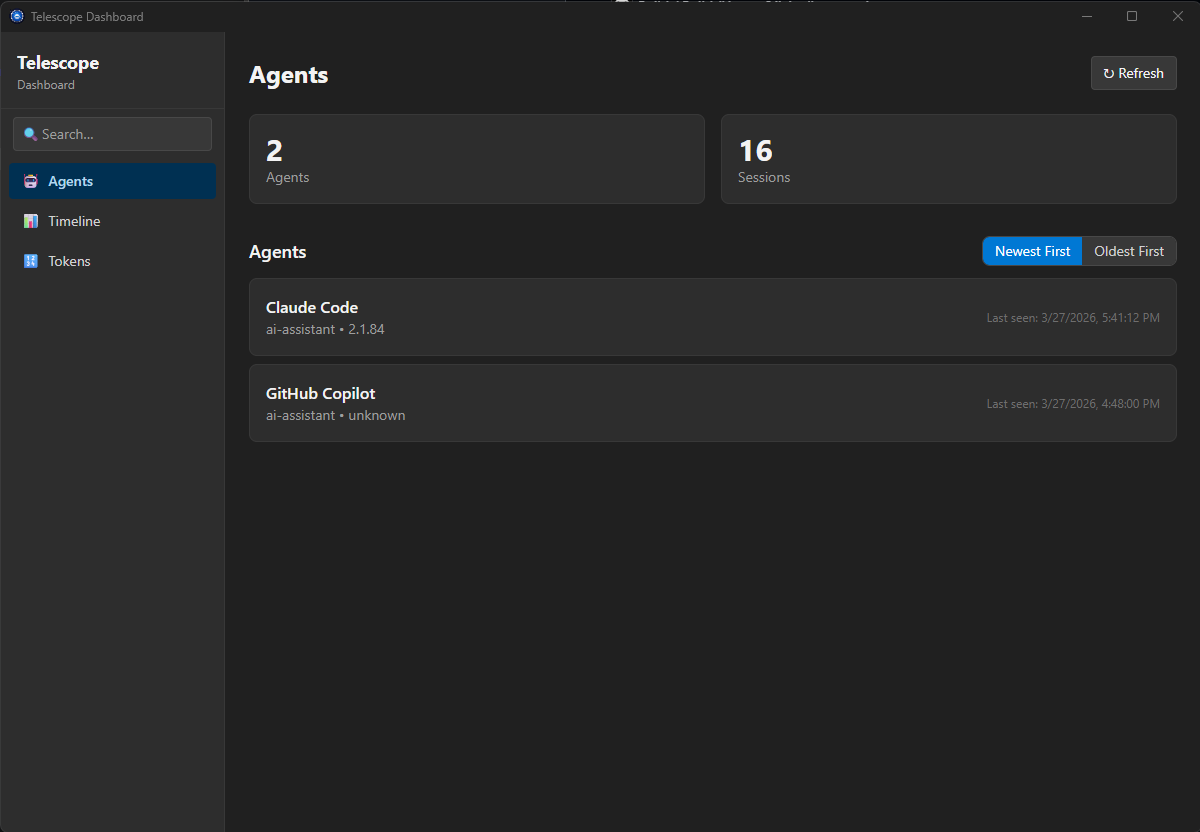
Telescope captures, structures, and surfaces what your AI agents do — tool calls, decisions, conversations, and reasoning — in one beautiful dashboard and CLI.
Copilot CLI    Claude CLI    OpenClaw    Any Agent
      |              |            |           |
      +--------------+------------+-----------+
                     |
                     v
                Collect --> Local Store --> Visualize
No cloud accounts. No API keys. No config files. Everything runs on your machine, and everything stays on your machine.
🔧 How It Works
Telescope has three layers:
-
Collectors (open-source) — shared libraries that watch AI agents and emit structured events. They hook into agent activity via stdin/stdout interception, JSONL log scanning, SDK hooks, and MCP proxy interception.
-
The Service (installed locally) — ingests collector events, stores them in local SQLite databases, and surfaces insights through a CLI and desktop dashboard.
-
CLI & Dashboard — a powerful command-line interface (
tele) and a desktop dashboard for exploring sessions, watching live events, and drilling into agent behavior.
The architecture is deliberately flat: every collector, whether built-in or community-authored, uses the exact same C-ABI interface. A collector you write has identical capabilities to one that ships in the box.
Agent (Copilot, Claude, your agent, etc.)
                |
                v
    Collector               <-- open-source, extensible
                |
                v
    Telescope Service       <-- local, no network egress
                |
          +-----+-----+
          v           v
      Dashboard      CLI
🚀 Key Features
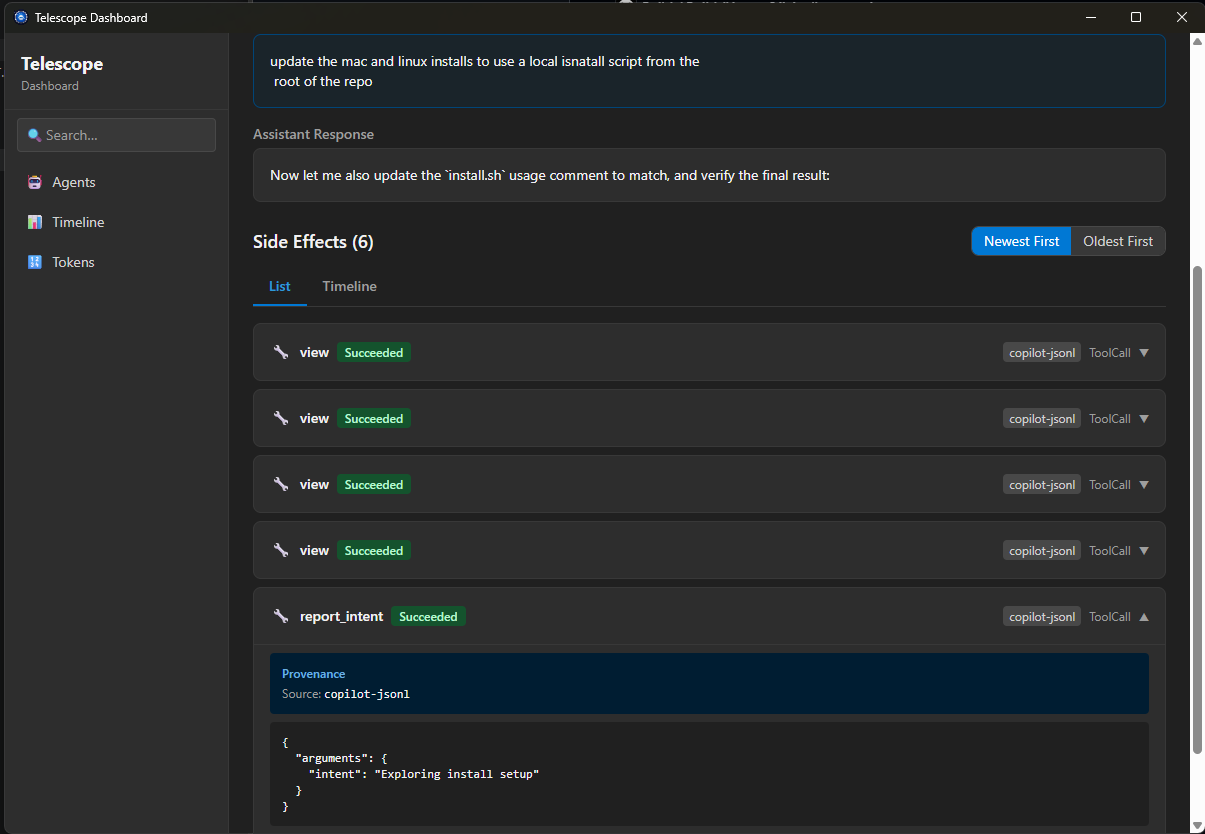
- 📊 Timeline view of all agent activity
- 🔗 Execution graph showing tool call relationships
- 🔄 Chat turn grouping (user → agent → response)
- 🧹 Automatic noise and duplicate filtering
- 🔀 Tool start/complete event merging
- 🏷️ Agent-specific parsing (Copilot, Claude, etc.)
- 📋 Full event data in detail pane
👀 What You See
| Category | Details | |
|---|---|---|
| 💬 | Conversations | Every user message and agent response, with full context and reasoning. |
| 🛠️ | Tool Calls | Which tools were called, with what arguments, and what they returned. |
| 🎯 | Decisions | Agent intents, reasoning, and choices. |
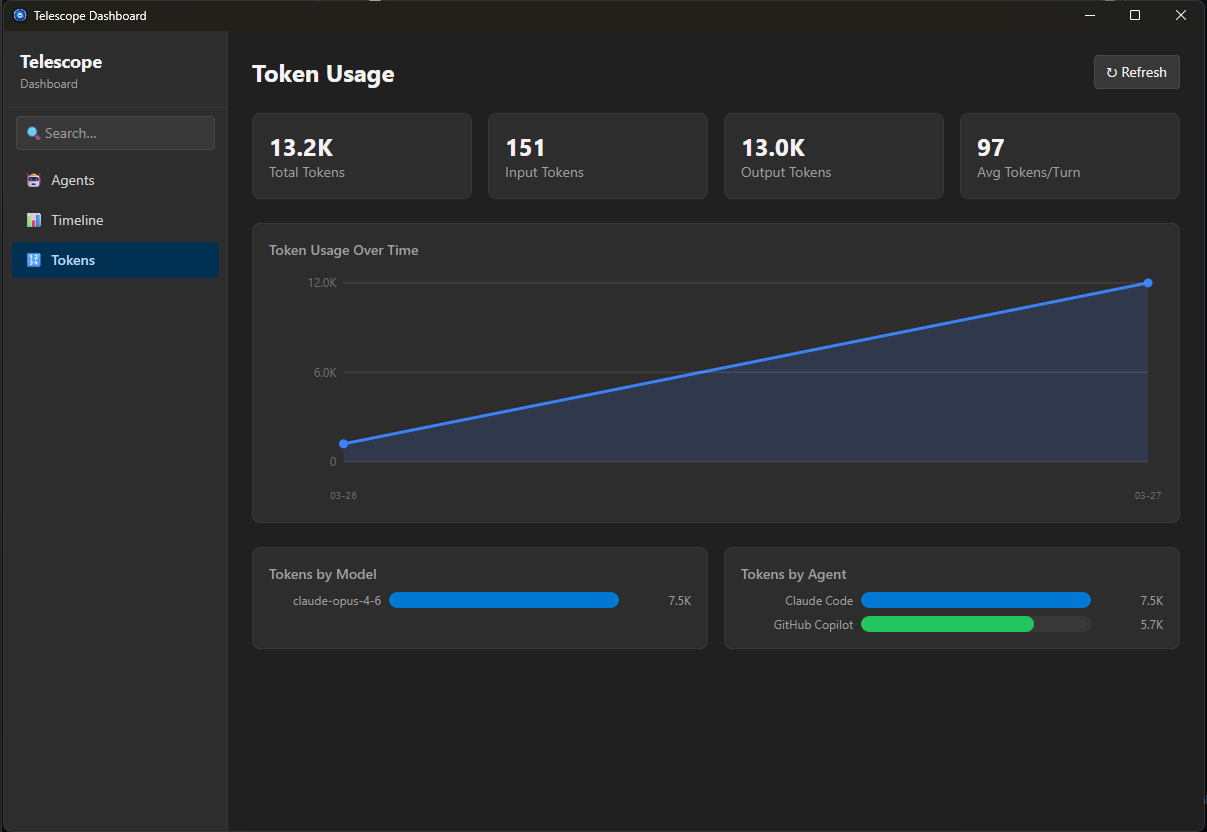
| ⚡ | Performance | Tool durations, session lengths, and execution patterns. |
This isn't just logging. It's a structured, queryable record of agent behavior that lets you debug failures, audit decisions, spot patterns, and understand where agents get stuck.
⚡ Quick Start
1️⃣ Install
Windows
Download the MSI from the releases page
winget install Microsoft.ProjectTelescope
This downloads and runs the MSI installer, which sets up the background service, dashboard, tele CLI, and all built-in collectors.
macOS & Linux
Download the latest binaries from the releases page.
2️⃣ Verify it's running
tele service status
3️⃣ See what your agents are up to
tele watch        # Live stream of agent activity
tele sessions     # Browse recent sessions
tele insights     # Surface patterns and anomalies
tele dashboard    # Launches the dashboard
4️⃣ (Optional) Build a custom collector
git clone https://github.com/microsoft/project-telescope.git
cd project-telescope/examples
cargo build --release
tele collector install ./target/release/
tele collector enable my-custom-collector
That's it. Your collector is now feeding events into the same pipeline as the built-in ones.
What's Next
Project Telescope is available now on Windows, macOS, and Linux. The collector plugin system is open-source under the MIT license.
If you've ever stared at an AI agent's output and wondered how it got there, give Telescope a look. Your agents are doing more than you think. Now you can finally see it.
🔭 See Everything. Debug Agents. Trust Your Agents.
Project Telescope is open-source preview project at github.com/microsoft/project-telescope. The collector SDK is MIT-licensed. The service, dashboard, and CLI are distributed as closed-source binaries under MIT license terms.
Built by Cassie Breviu and Daniel Pagan